Recently we’ve found an interesting discovery and hope this will be very helpful to you all, who are struggling with “Classic ASP” debugging through “Response.Write()” methods.
The good news is, you can debug your “Classic ASP” applications through Visual Studio (2003,2005 and all the way up to 2012) and support breakpoints.
Steps are given below: (We’ve used Windows7 and IIS7)
1. Ensure Prerequisites
1.1 IIS7 has to be installed [Control Panel->Programs and Features->Turn Windows Features On/Off]
1.2 Machine Debug Manger Service should be automatic and started [start->run->services.msc]
2. Host your “Classic ASP” website in IIS [start->run->inetmgr]
2.1 Create a application pool in “Classic Pipeline Mode” [Say GF]
2.2 In advanced settings set “Identity” as “Local System”
2.3 Create your “Classic ASP” website [Virtual directory will be your asp application folder] in IIS and select the Above Pool [in this ex: GF]
2.4 Enable server script debugging and error to browser option
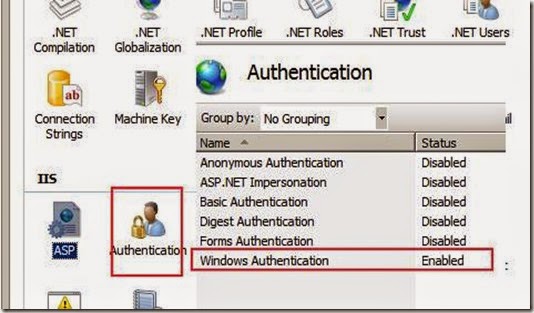
2.5 Enable windows authentication [as per your need. You can set whatever authentication scheme you want]
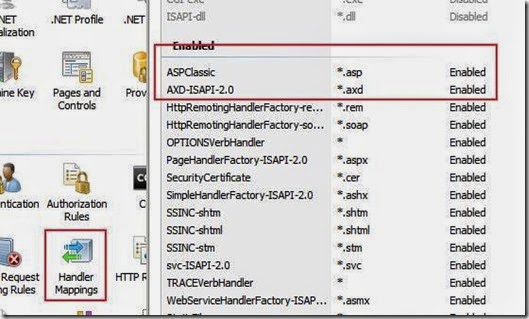
2.6 Ensure *.asp is mapped to ISAPI filter and enabled.
2.7 Now restart your website and browse to your start page (say default.asp) – This will kick-in the worker process
3. Debug with VS2010 [You can use 2003/2005/2012 e.t.c]
3.1 Start VS2010 in administrator mode [Open as administrator menu item]
3.2 Attach visual studio to your classis ASP website worker process [Menu->Debug->Attach To Process…]
Carefully note the items shown in red rectangles.
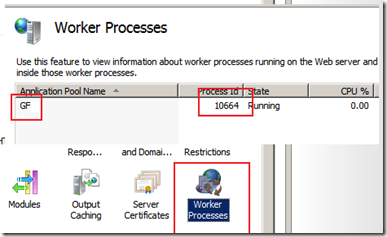
Note: You can always find your ‘Classic ASP’ worker process ID, by looking at the ‘Worker Process’ feature in IIS as below
3.3 Now open the required classic ‘asp’ pages and put the break-points in required locations.
3.4 Now browse to your required pages and do the necessary actions, So that the break points will be hit
3.5 And there you are!!!, You have arrived at your break point. Add watch or quick watch your variables and values. Step in/Step out or just F10 to debug line by line.
3.6 Say good bye to “Response.Write()” and welcome VS2010 debugger for “Classic ASP”
Notes:
a. You cannot debug your remote servers (like staging/production). You’ve to setup your local IIS. But you can point any network share where your code resides
b. Sometimes you may need to add yourself to the debug group as below [Start->Run->Gpedit.msc]
Happy Debugging!


No comments:
Post a Comment